Apple Game Difficulty Analysis
Published March 22, 2026
Summary
We analyzed the boards of 500 rounds from the original Apple Game to find a simple metric that can estimate board difficulty. In conclusion, the total sum of board numbers best predicts difficulty (r = -0.751), and based on this, we can assign a 6-level difficulty rating from ☆☆☆☆☆ to ★★★★★.
1. Overview
How can we determine the difficulty of a generated board? Computing the maximum possible score for a given board is a problem close to NP-Hard, making it practically impossible to calculate exact difficulty scores in bulk. Moreover, even if we obtained a high maximum score, that does not guarantee the board feels easy to play — there are certainly edge cases where only an unusual opening move enables such a high score.
Nevertheless, we wanted to find a way to roughly estimate difficulty in polynomial time, so we analyzed the board data from 500 rounds of the original game.
We assumed that the true difficulty perceived by players is determined by the score obtainable by a greedy solver, and compared 10 metrics that can be computed with minimal computation.
2. Difficulty Measurement Method
To measure difficulty, we used a simple Greedy Algorithm. This algorithm behaves like a player with excellent eyesight and very fast hands but who barely thinks ahead. Specifically:
- Find all rectangular regions on the board whose numbers sum to 10
- Prioritize the combination that contains the largest number (ties broken by fewer cells)
- Remove the numbers in the selected region
- Repeat until no more valid combinations remain
In short, it always eliminates the largest available number first among current possibilities.
3. Difficulty Measurement Results
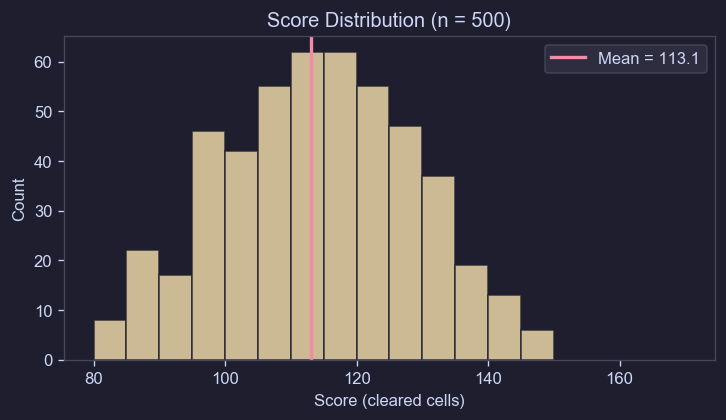
Figure 1. Score Distribution
Scores range from 69 to 149, with a mean of 113.1 and a standard deviation of 15.4.
4. Difficulty Estimation Metrics
Since applying the greedy algorithm to every board is impractical, we looked for simpler metrics that can estimate difficulty.
4.1 Board Sum
A higher sum means more large numbers, and large numbers are harder to pair. Therefore, a higher sum leads to lower scores.
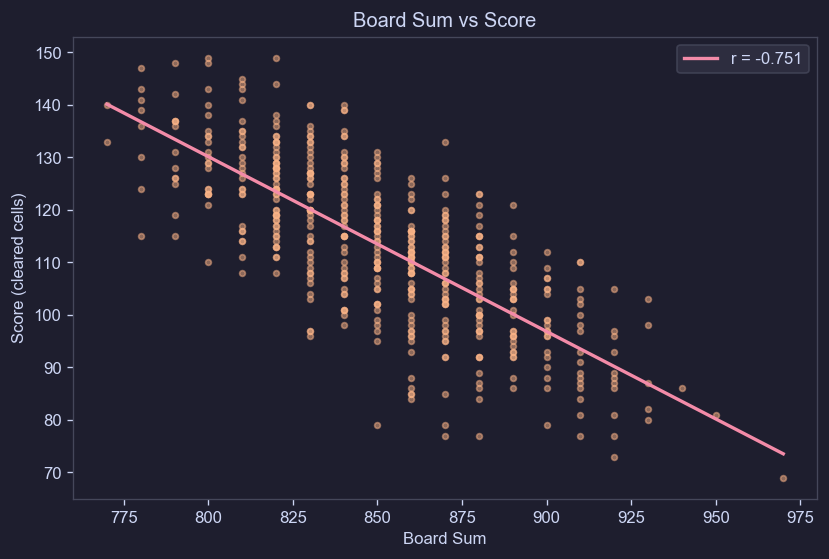
Figure 2. Board Sum vs Score (r = -0.751)
| Metric | Value |
|---|---|
| Correlation coefficient (r) | -0.751 |
| Coefficient of determination (r²) | 0.564 |
| Regression formula | score ≈ -0.33 × sum + 397 |
| Mean score | 113.1 |
| Score standard deviation | 15.4 |
With r² = 0.564, about 56% of score variance can be explained by the board sum alone.
4.2 Correlation by Digit
We checked which digits are associated with higher scores and which with lower scores when their count increases.
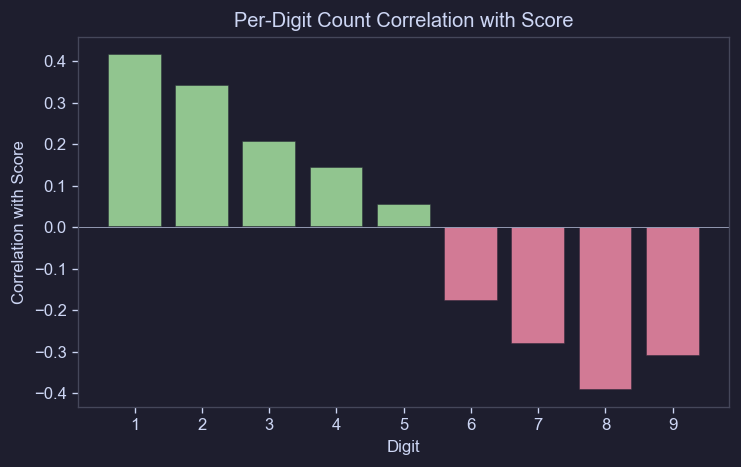
Figure 3. Correlation Between Digit Count and Score
More small numbers (1, 2, 3) lead to higher scores, while more large numbers (7, 8, 9) lead to lower scores. In particular, 9 has the strongest negative correlation because 9 can only pair with 1.
4.3 Comparison with Other Metrics
We also investigated other metrics that might predict difficulty beyond the board sum.
| Metric | Description | r | |r| |
|---|---|---|---|
| Board Sum | Sum of all 170 cells | -0.751 | 0.751 |
| High/Low Ratio | Large numbers / small numbers ratio | -0.718 | 0.718 |
| Low (1+2+3) | Combined count of 1, 2, 3 | +0.639 | 0.639 |
| High (7+8+9) | Combined count of 7, 8, 9 | -0.617 | 0.617 |
| Count of 1 | Count of 1s | +0.418 | 0.418 |
| Count of 9 | Count of 9s | -0.309 | 0.309 |
| Adjacent Pairs | Number of adjacent cell pairs summing to 10 | +0.306 | 0.306 |
| Min(#9, #1) | Smaller of count of 9s and 1s (available 9+1 pairs) | +0.112 | 0.112 |
| Digit Count SD | Standard deviation of digit counts (skewness) | -0.066 | 0.066 |
| Count of 5 | Count of 5s | +0.056 | 0.056 |
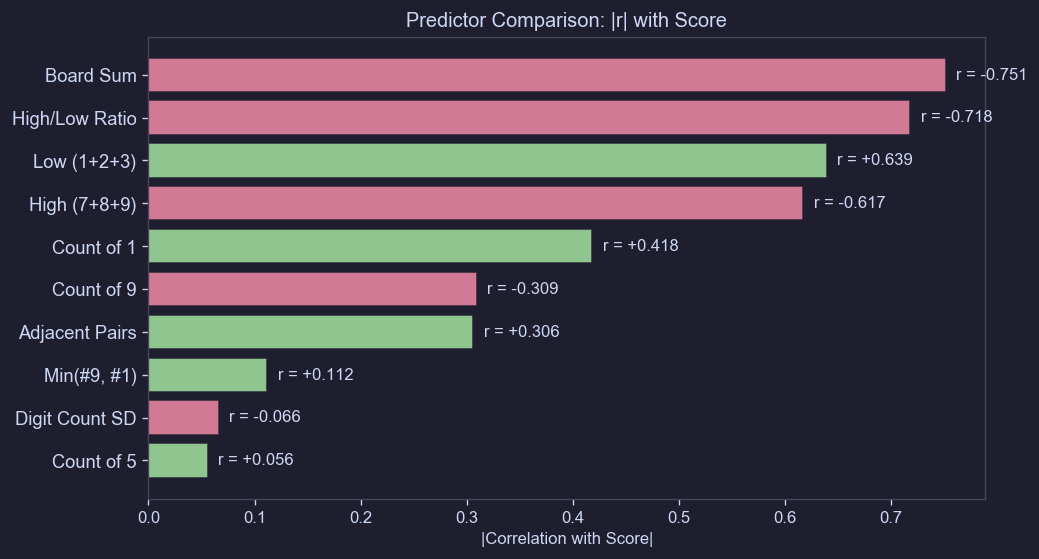
Figure 4. Comparison of Score Prediction Power by Metric
Board Sum has the highest |r| = 0.751. This makes sense since the sum is essentially a weighted sum of all digits. Among individual digits, the count of 9 shows the strongest predictive power.
An interesting finding is that the number of adjacent pairs (Adjacent Pairs) has a relatively low correlation. While having many adjacent pairs seems like it would make the board easier, in practice which numbers are involved matters more for the score than the number of pairs.
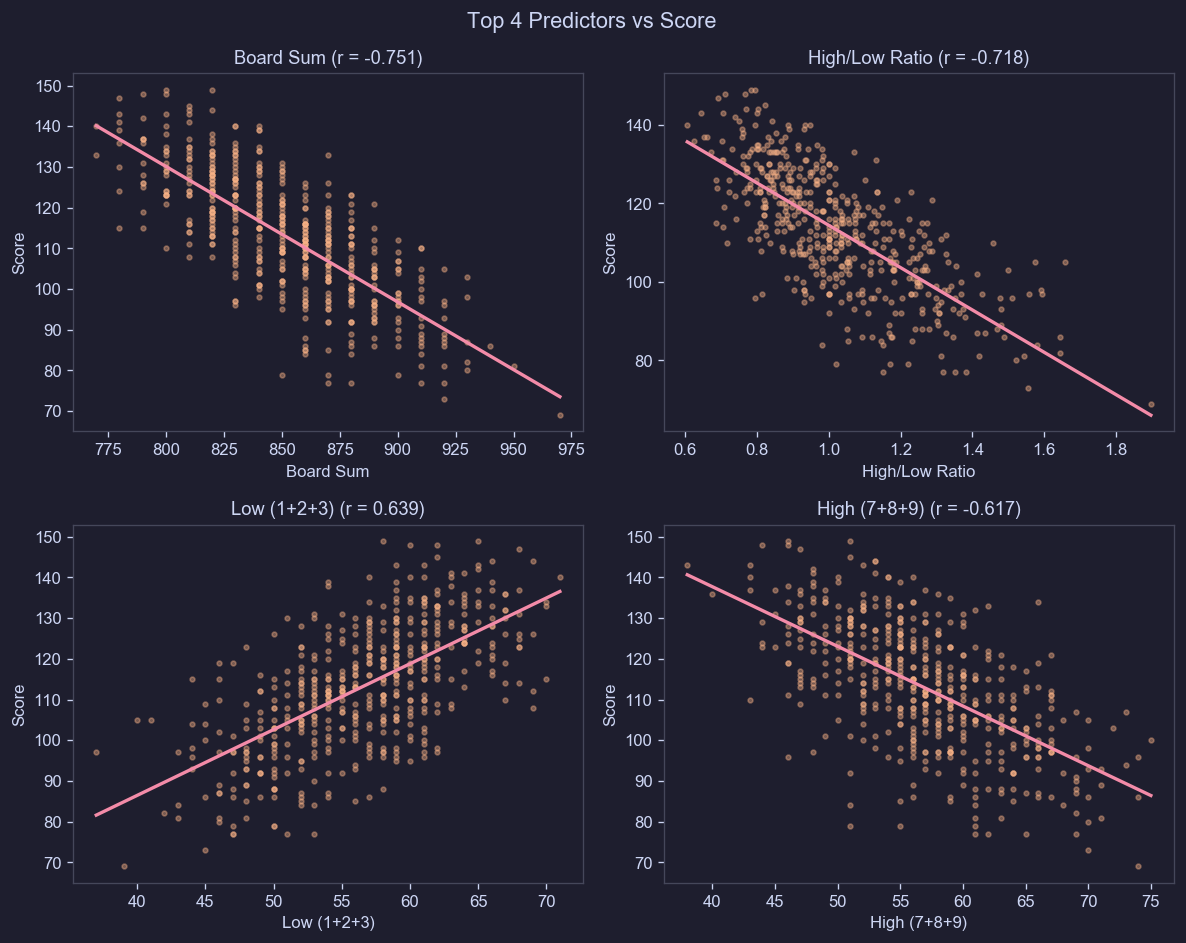
Figure 5. Score Scatter Plots for Top 4 Metrics
5. Estimated Difficulty Rating Method
We assigned a 6-level difficulty rating based on the board sum ranges.
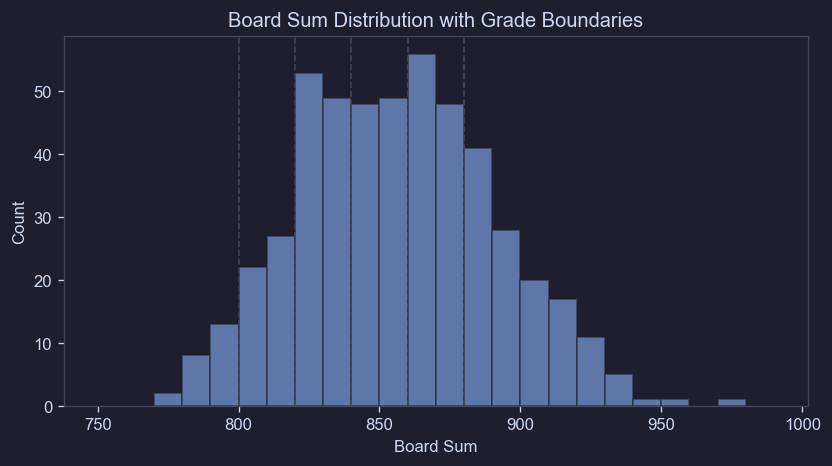
Figure 6. Sum Distribution and Grade Boundaries
| Grade | Name | Sum Range | Boards | Avg Score | Min | Max |
|---|---|---|---|---|---|---|
| 0 | ☆☆☆☆☆ | 0–799 | 23 | 132.8 | 115 | 148 |
| 1 | ★☆☆☆☆ | 800–819 | 49 | 128.8 | 108 | 149 |
| 2 | ★★☆☆☆ | 820–839 | 102 | 122.6 | 96 | 149 |
| 3 | ★★★☆☆ | 840–859 | 97 | 115.9 | 79 | 140 |
| 4 | ★★★★☆ | 860–879 | 104 | 107.2 | 77 | 133 |
| 5 | ★★★★★ | 880+ | 125 | 98.2 | 69 | 123 |
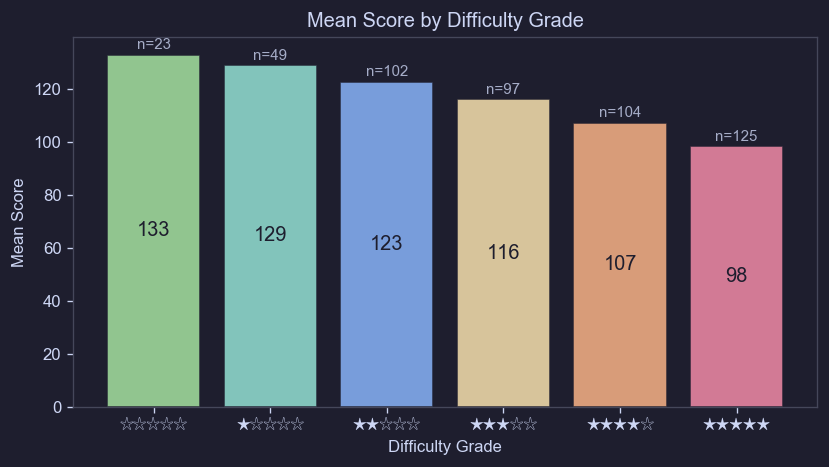
Figure 7. Average Score by Grade
Average scores clearly decrease as the grade increases. The difference in average score between ☆☆☆☆☆ and ★★★★★ reaches 35 points.
6. Conclusion
After solving 500 original boards with a greedy solver, we found that board difficulty has a strong correlation with the number distribution. In particular, the total sum of board numbers alone can reasonably estimate board difficulty. We also confirmed the following findings:
- The board sum alone explains 56% of score variance. A larger sum means more large numbers, making it harder to form pairs.
- Among individual digits, the count of 9 has the greatest impact on difficulty. This is because 9 can only pair with 1. Conversely, a higher count of 1 makes the board easier, since 1 not only pairs with 9 but can also flexibly form combinations with other numbers.
- On the other hand, metrics like the number of adjacent pairs or the count of 5 have surprisingly low predictive power, contrary to intuition.
- Interestingly, the count of 8 shows a stronger negative correlation with score than 9 (r = -0.392 vs -0.309). Since this solver processes large numbers first, 9 gets paired quickly with 1 while the board is still dense. However, 8 only gets its turn after all 9s are processed, and by then the board has many empty cells, making it harder to find valid rectangles. A strategy that processes 8 first might yield different results, which remains a topic for future research.
As a result, we assigned a 6-level "estimated difficulty" rating from ☆☆☆☆☆ to ★★★★★ based on the board sum. This allows us to present a reasonably convincing difficulty rating with very little computation. Feedback from actual players has been mostly positive regarding the difficulty grades, although there were occasional comments about boards feeling too hard despite a low star rating.