Difficulty Analysis: Comparing with the Original Apple Game
Published March 13, 2026
Abstract
We extracted 500 boards from the original Apple Game (Fruits Box) using screenshots and OCR, then statistically analyzed the board generation algorithm. After examining a total of 85,000 digits, we found that each cell is drawn independently and uniformly from 1 to 9, with no evidence of positional bias, adjacent-cell correlation, or digit clustering. We also confirmed that the total sum of all digits on each board varied from board to board, and was always a multiple of 10. Based on these findings, we hypothesized that the original Apple Game generates boards using Rejection Sampling, and boards generated with our implementation showed no significant difference from the original data according to a KS test (p=0.65).
TL;DR: Our Apple Game's board difficulty is identical to the original Apple Game.
1. Introduction
The Apple Game (Fruits Box) is a puzzle game where numbers from 1 to 9 are placed on a 17x10 grid, and players select rectangular regions that sum to 10 to clear them. After playing hundreds of rounds of this simple yet addictive game, one notices that the difficulty varies each round and is determined by the distribution of numbers on the board. Generally, more large numbers mean harder boards, and in some cases, even near-optimal play yields very low scores.
Consider these extreme examples:
- If all 170 cells contain 9, the total sum is 1,530, but no combination can make 10, resulting in a score of 0
- Conversely, if all cells contain 1, the total sum is 170, and any 10 cells will sum to 10, making it a near perfect score round
Real boards fall somewhere between these extremes. Still, having more large numbers (7, 8, 9) makes things noticeably tougher, while having more small numbers makes forming combinations easier. Players above a certain skill level will find most visible number pairs by the time the timer runs out, so the number distribution on the board plays a major role in determining scores.
Some derivative games view this as "unfair" and deliberately adjust the number distribution. However, I believe this element of luck is a core part of the original game's appeal. Because difficulty varies slightly each round, it creates tension and encourages diverse strategies. This is especially true in competitive play, where the board luck factor adds great excitement — one player might score their best on a favorable board, while another squeezes maximum points from a tough board, making outcomes more unpredictable and thrilling.
However, the original game doesn't support playing on the same board, so competitive play was limited to comparing averages over N games. Since N wasn't large enough, there were times when the luck factor felt frustratingly dominant, which is why we created this game where players can play on the same board simultaneously. We wanted to maintain the original's characteristic of varying board difficulty while having shared boards, so that "strategizing around board difficulty" becomes part of the game.
Therefore, "reproducing the same difficulty distribution as the original" was important. Not harder, not easier. So we collected 500 boards from the original game and analyzed how they were generated.
2. Methods
2.1 Board Collection
We automated gameplay on the original site using Playwright (headless Chromium, 2x resolution).
Connect → Play → Screenshot → Refresh
This process was repeated 500 times to collect board images.
2.2 OCR Pipeline
The process of reading numbers from screenshots proceeded in the following order.
1. Green border detection — HSV thresholding to find the game frame.
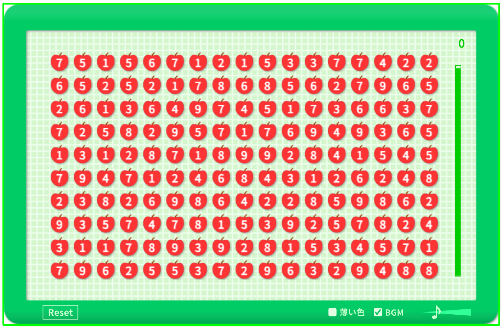
Figure 1. Green border detection result
2. Apple region crop — Using a red HSV mask to crop only the apple regions.
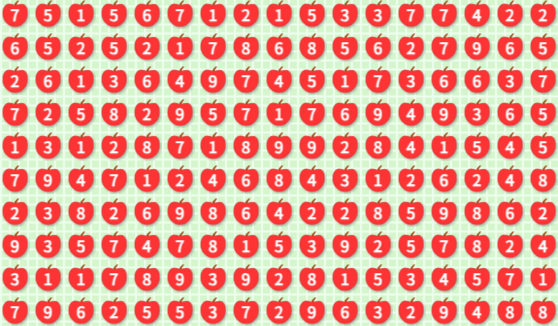
Figure 2. Cropped apple region
3. Grid alignment — Using centroids and 1D clustering to align a 10-row x 17-column grid.
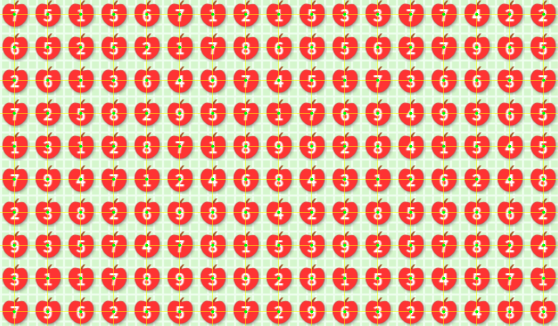
Figure 3. Grid alignment (yellow lines: row/column centers, green dots: cell centers)
4. Per-cell OCR — Each 60x60 px cell is preprocessed and then read by Tesseract.
Preprocessing steps:
- Margin crop (top 17, bottom 10, left/right 19 px)
- Grayscale → threshold 200 → invert
- Pad 15px → resize 128x128 → threshold 128
- Tesseract
--psm 6 --oem 1 -c tessedit_char_whitelist=123456789

60x60 cell→

Crop→

Gray→

Thresh→

Invert→

Final→7

60x60 cell→

Crop→

Gray→

Thresh→

Invert→

Final→9

60x60 cell→

Crop→

Gray→

Thresh→

Invert→

Final→8
Figure 4. Per-cell OCR preprocessing examples
2.3 Data Integrity Verification
2.3.1 Checksum Verification
Each board consists of 170 numbers ($d_i \in \{1, \dots, 9\}$), and the game rules require the sum to be a multiple of 10.
$$\sum_{i=1}^{170} d_i \equiv 0 \pmod{10}$$In other words, if OCR made errors, this condition would likely be violated. Assuming errors are random substitutions, the probability of accidentally passing the checksum despite errors is roughly 1/10.
$$P_{\text{false\_pass}} \approx \frac{1}{10}$$Result: all 500 boards passed the checksum.
2.3.2 Manual Verification
To catch cases where multiple errors might cancel each other out and accidentally pass the checksum, we manually compared 25 boards (5% of the total) against their screenshots. We visually inspected a total of 4,250 digits (170 x 25), and found 0 errors.
When $n$ inspections yield zero errors, the 95% confidence upper bound on the error rate $p$ can be estimated using the Rule of Three:
$$p \le \frac{3}{n} = \frac{3}{25} = 0.12 \quad (12\%)$$2.3.3 Combined Confidence
The two verification methods are independent, so the combined probability of an undetected error is:
$$P_{\text{undetected}} = p \times P_{\text{false\_pass}} \approx 0.12 \times 0.1 = 0.012 \quad (1.2\%)$$In other words, the statistical confidence of the dataset is 98.8%, indicating that the OCR processing was reliable.
3. What Patterns Did We Find?
3.1 Digit Frequencies Were Nearly Perfectly Uniform
Counting all 85,000 digits across 500 boards, digits 1 through 9 appeared at nearly identical rates.
| Digit | 1 | 2 | 3 | 4 | 5 | 6 | 7 | 8 | 9 |
|---|---|---|---|---|---|---|---|---|---|
| Count | 9,479 | 9,381 | 9,373 | 9,422 | 9,371 | 9,562 | 9,512 | 9,319 | 9,581 |
| % | 11.15 | 11.04 | 11.03 | 11.08 | 11.02 | 11.25 | 11.19 | 10.96 | 11.27 |
| Uniform | 11.11 | 11.11 | 11.11 | 11.11 | 11.11 | 11.11 | 11.11 | 11.11 | 11.11 |
The chi-squared test also yielded chi-sq = 7.30, p = 0.504. This means we could not reject the hypothesis that "each digit appears with equal probability" at all.
This is quite significant. It means there is no evidence of deliberate adjustment of the overall digit distribution.
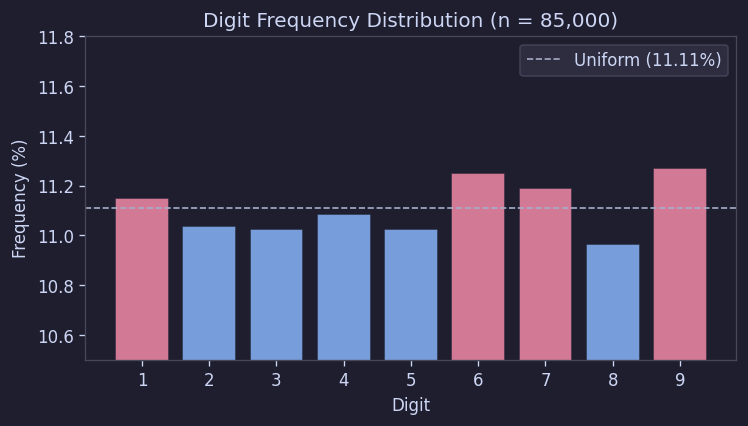
Figure 5. Digit frequency distribution
3.2 Board Totals Also Matched Theoretical Values
If 170 cells are drawn independently from a uniform distribution over 1 to 9, the theoretical mean of the board total is 850 with a standard deviation of about 33.7.
The observed values were a mean of 851.3 and a standard deviation of 34.8.
This is essentially the same as the theoretical prediction. In other words, the total distribution alone is consistent with "basically drawing 170 uniform random numbers."
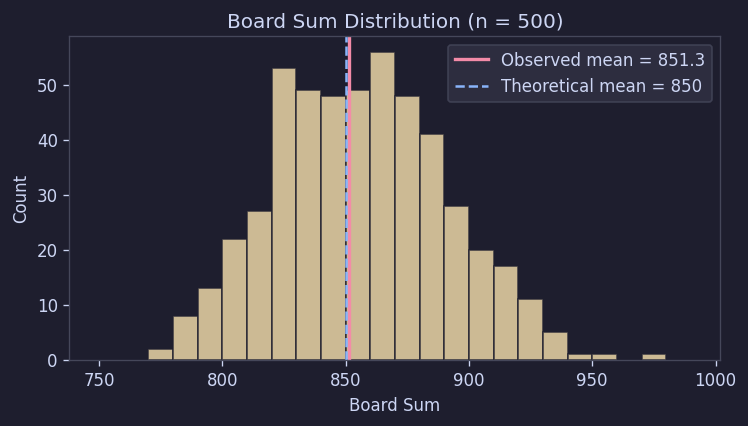
Figure 6. Board total distribution
3.3 No Positional Bias for Specific Digits
We checked whether certain positions tend to have larger numbers, or whether edges differ from the center. So we examined the per-cell average values.
The result was very simple. Across 500 boards, all cells clustered around 5.0, with row averages in the range [4.97, 5.04] and column averages in [4.92, 5.07].
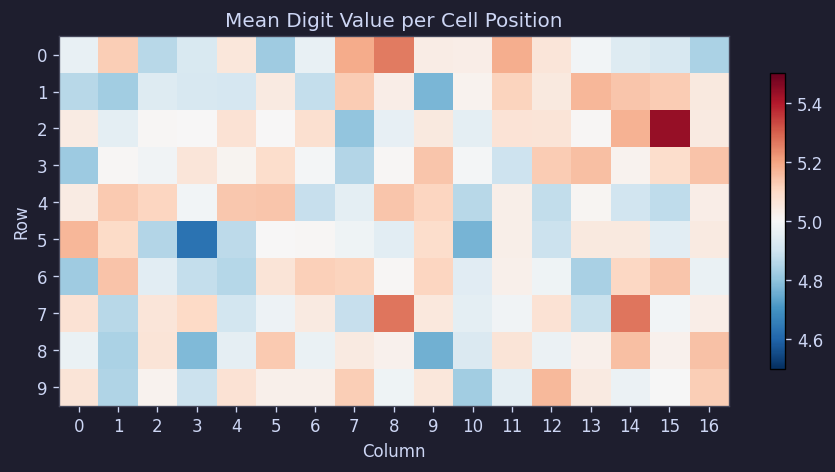
Figure 7. Per-cell average digit heatmap
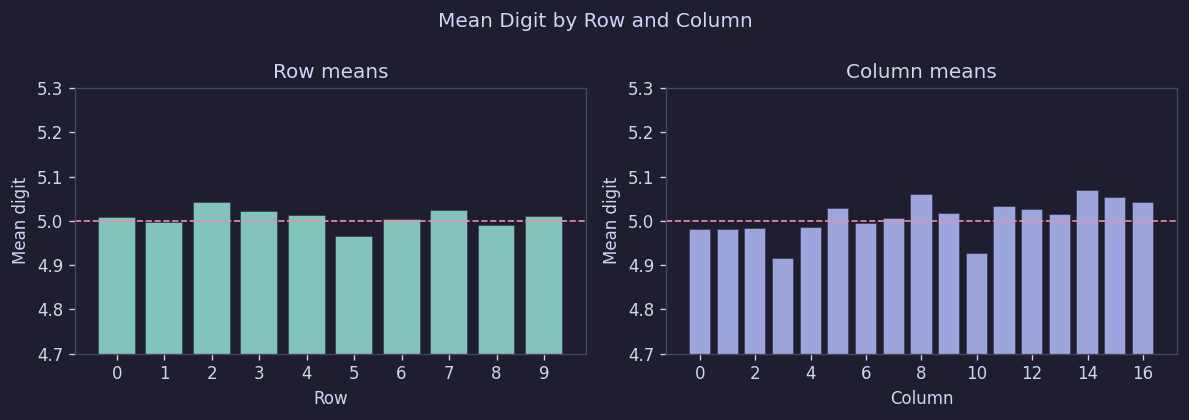
Figure 8. Row/column average digits
In short, no positional bias was found. There is no structure like "top rows are made easier" or "larger numbers are concentrated in the center."
3.4 Overall Uniform, but Individual Boards Vary Considerably
What's interesting here is that although the overall distribution looks perfectly uniform, individual boards can be quite imbalanced. Some boards have unusually many 9s, while others have relatively many 1s or 2s. The feeling of "why is this round so hard" during play is actually reflected in the data.
To quantify this, we calculated chi-squared values by comparing each board's digit composition to the expected value (18.89 per digit). Under independent uniform distribution, these values should follow a chi-sq(df = 8) distribution.
| Observed (500) | Rejection Sampling (10,000 sim) | chi-sq(df=8) Theoretical | |
|---|---|---|---|
| Mean | 8.22 | 7.99 | 8.00 |
| Median | 7.46 | 7.35 | 6.34 |
| Std Dev | 4.17 | 3.94 | 4.00 |
The observed values matched the theoretical values quite well and nearly overlapped with simulation results. In other words, "individual boards being variable" is actually a natural phenomenon. It's not evidence of intentional difficulty adjustment, but rather the expected variability from random generation.
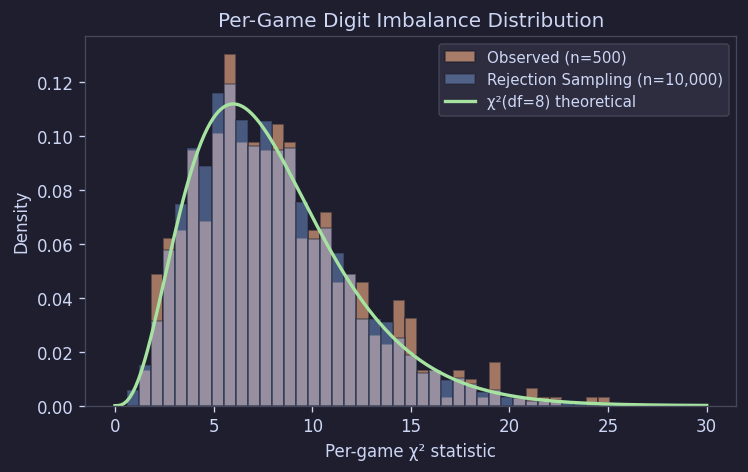
Figure 9. Per-board chi-squared distribution (Observed vs Simulation vs Theoretical)
This can also be confirmed with a Q-Q plot:
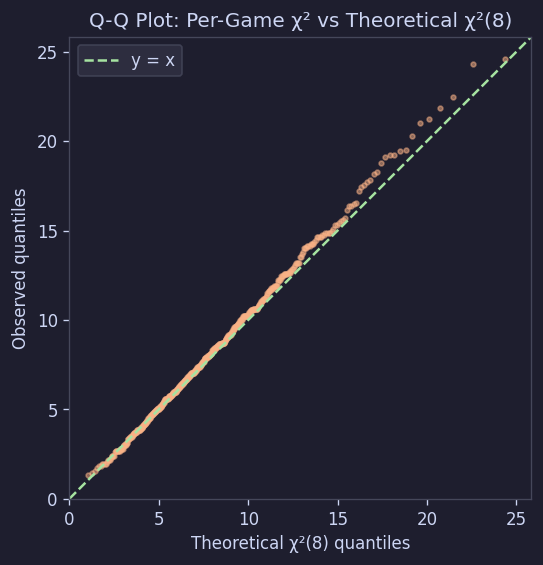
Figure 10. Q-Q plot: Per-board chi-sq vs Theoretical chi-sq(8)
Maximum Deviation and Deficit/Surplus Patterns
Looking at the maximum deviation from the expected value for each board also matched well with the simulation:
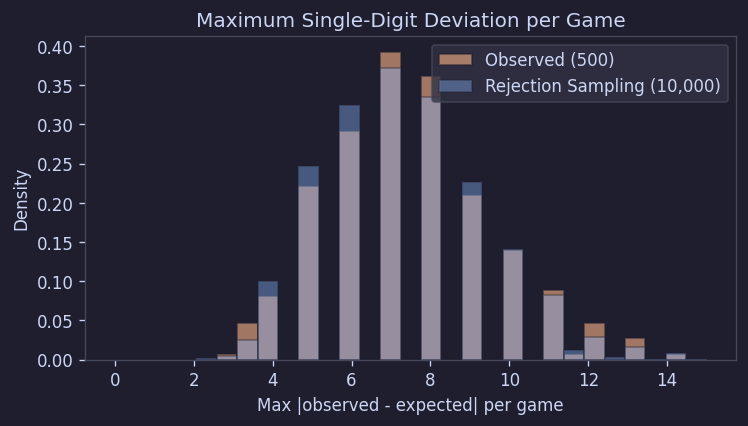
Figure 11. Per-board maximum deviation distribution
When counting the "most frequent digit" or "least frequent digit" per board, there was no clustering toward specific digits:
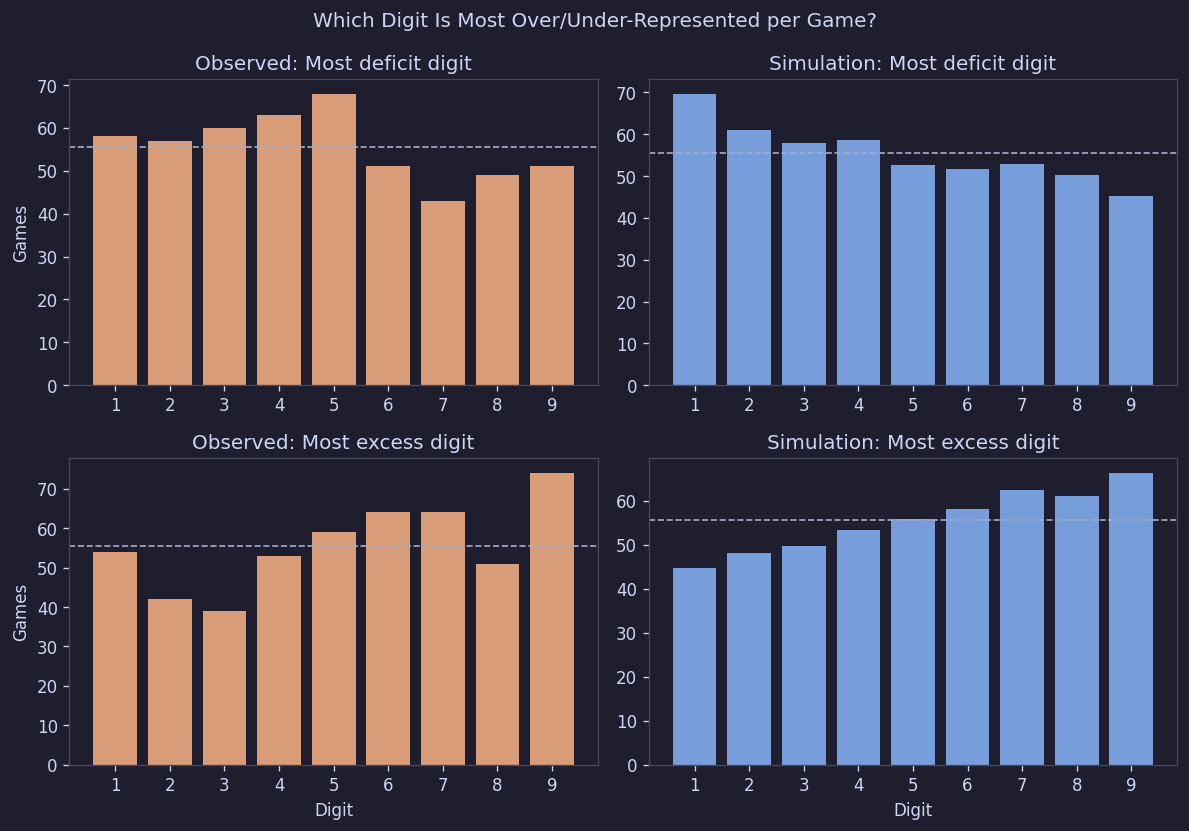
Figure 12. Per-board deficit/surplus digit patterns
Simply put, no digit was systematically over-represented or under-represented.
3.5 Adjacent Cells Were Essentially Independent
There could be some correlation between adjacent cells — for example, similar digits clustering together, or large digits following small ones.
So we calculated adjacent-cell correlations.
| Direction | n | Pearson r | p-value |
|---|---|---|---|
| Horizontal | 80,000 | 0.0007 | 0.853 |
| Vertical | 76,500 | -0.0012 | 0.730 |
Both were essentially zero.
The transition matrix (probability of digit j following digit i) was also within ±0.5 percentage points of the expected 11.1%:
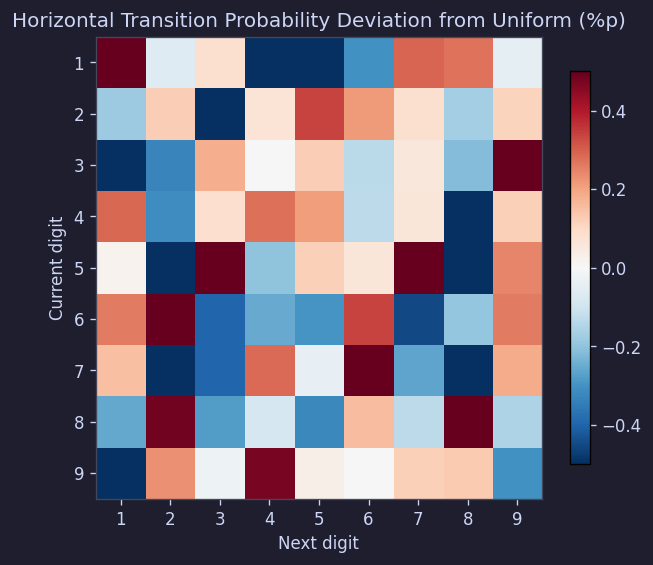
Figure 13. Horizontal transition probability deviation matrix
The autocorrelation function also fell within the 95% confidence interval at all lags:
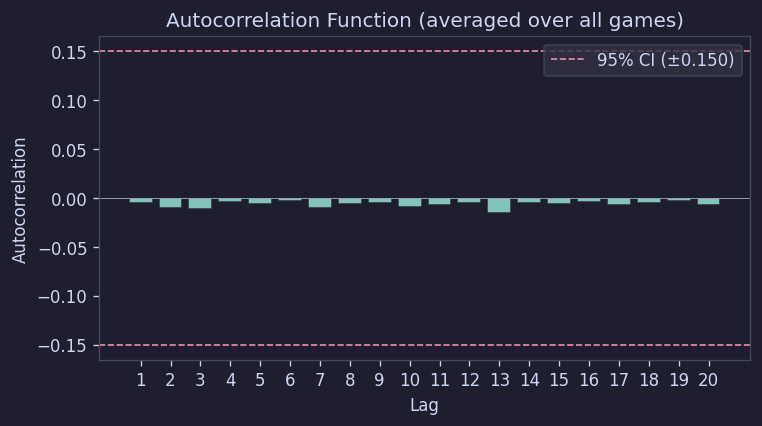
Figure 14. Autocorrelation function
In conclusion, digits appear to be placed without any special relationship to neighboring cells.
4. So What Is the Generation Algorithm?
Summarizing the results so far:
- Each cell's digit is drawn uniformly from 1 to 9
- There are no special correlations between cells
- There is no positional bias
- However, the total sum must always be a multiple of 10
The simplest method that satisfies all these conditions is rejection sampling.
That is:
- Fill all 170 cells with random numbers
- Calculate the sum
- If the sum is a multiple of 10, accept the board
- Otherwise, discard and start over
In pseudocode:
FUNCTION GenerateBoard(rows, cols)
    REPEAT
        board ← EMPTY 2D ARRAY [rows x cols]
        FOR r ← 0 TO rows - 1 DO
            FOR c ← 0 TO cols - 1 DO
                board[r][c] ← RANDOM INTEGER IN [1, 9]
            END FOR
        END FOR
        s ← SUM OF ALL ELEMENTS IN board
    UNTIL s MOD 10 = 0
    RETURN board
END FUNCTION
5. Does This Model Actually Match the Original?
We simulated 10,000 boards using rejection sampling and compared them with the actual data.
The KS test comparing per-board chi-squared distributions yielded the following result:
| Test | D Statistic | p-value | Conclusion |
|---|---|---|---|
| Observed vs Rejection Sampling | 0.0335 | 0.65 | No difference |
A p-value of 0.65 means there is no evidence that the two distributions differ, at least based on this data. In other words, the model matches the actual original boards very well.
6. Implementation
In practice, this can be implemented directly with code like the following:
// TypeScript
function generateBoard(): number[][] {
    const ROWS = 10, COLS = 17;

    while (true) {
        const board: number[][] = [];
        let sum = 0;

        for (let r = 0; r < ROWS; r++) {
            board[r] = [];
            for (let c = 0; c < COLS; c++) {
                board[r][c] = Math.floor(Math.random() * 9) + 1;
                sum += board[r][c];
            }
        }

        if (sum % 10 === 0) return board;
    }
}
Comparing 500 boards generated this way against the original also showed no significant difference.
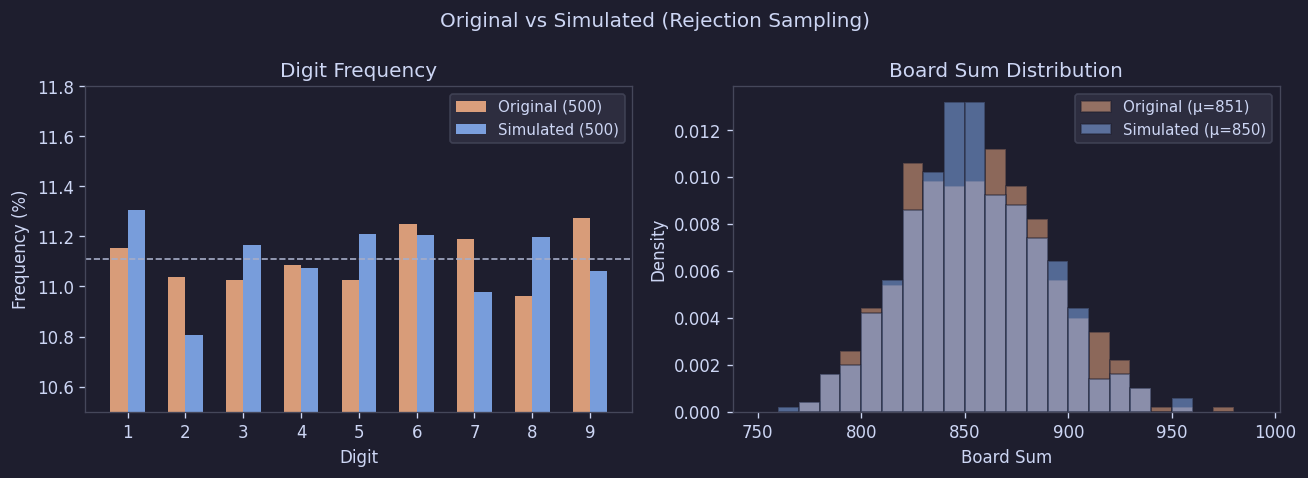
Figure 15. Original vs generated board comparison
| Metric | Original (500) | Generated (500) | KS p-value |
|---|---|---|---|
| Sum mean | 851.3 | 849.9 | 0.56 |
| Per-board chi-sq mean | 8.22 | 8.08 | 0.82 |
In other words, digit composition, total distribution, and per-board variance were all indistinguishable between generated and original boards.
7. Conclusion
After analyzing 500 boards, we estimate that the original Apple Game's board generation method is rejection sampling, with no additional positional rules, post-processing adjustments, or difficulty tuning.
Based on this analysis, we implemented the following board generation logic:
- Fill each of the 170 cells with a random number from 1 to 9
- Calculate the total sum
- If the sum is a multiple of 10, accept it; otherwise discard and regenerate
When we compared boards generated with our implementation against 500 original boards, the two datasets were statistically indistinguishable. The perceived difficulty variation during actual play was also very similar to the original. The fact that some rounds feel inexplicably easy while others feel unusually difficult — that aspect was faithfully reproduced exactly as intended.